
Alcohol Use in the United States: Age Groups & Demographic Characteristics
Lorem ipsum dolor sit amet, consectetur adipiscing elit. Ut elit tellus, luctus nec ullamcorper mattis, pulvinar dapibus leo.
Adults Ages 18 and Older
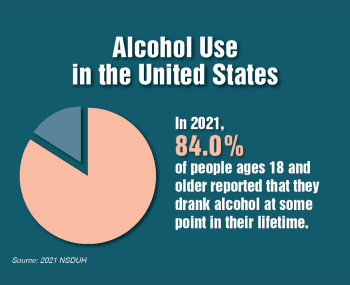
According to the 2021 NSDUH, 213.2 million adults ages 18 and older (84.0% in this age group) reported that they drank alcohol at some point in their lifetime.1,2 This includes:
- 106.5 million men ages 18 and older (86.2% in this age group)1,2
- 106.7 million women ages 18 and older (81.9% in this age group)1,2
- 140.7 million White adults ages 18 and older (89.1% in this age group)1,2
- 23.3 million Black or African American adults ages 18 and older (75.7% in this age group)1,2
- 1.4 million American Indian or Alaska Native adults ages 18 and older (84.7% in this age group)1,2
- 9.9 million Asian adults ages 18 and older (65.8% in this age group)1,2
- 3.9 million adults of two or more races ages 18 and older (87.1% in this age group)1,2
- 33.5 million Hispanic or Latino adults ages 18 and older (77.6% in this age group)1,2
- Estimates for Native Hawaiian or other Pacific Islander adults ages 18 and older were not presented because they were based on a relatively small number of respondents or had a large margin of error.1,2
Alcohol & Young Adults age 18-25
According to the 2021 National Survey on Drug Use and Health (NSDUH), 16.6 million young adults ages 18 to 25 (49.7% in this age group) reported that they drank alcohol in the past month.1,2 This includes:
- 8.1 million males ages 18 to 25 (48.5% in this age group)1,2
- 8.7 million females ages 18 to 25 (51.8% in this age group)1,2
- 10.1 million White young adults ages 18 to 25 (57.2% in this age group)1,2
- 1.8 million Black or African American young adults ages 18 to 25 (39.8% in this age group)1,2
- 643,000 Asian young adults ages 18 to 25 (32.9% in this age group)1,2
- 430,000 young adults of two or more races ages 18 to 25 (47.2% in this age group)1,2
- 3.5 million Hispanic or Latino young adults ages 18 to 25 (44.8% in this age group)1,2
- 4.8 million full-time college students ages 18 to 25 (51.8%) and 11.8 million other persons of the same age (49.0%)3
- Estimates for American Indian or Alaska Native and Native Hawaiian or other Pacific Islander young adults ages 18 to 25 were not presented because they were based on a relatively small number of respondents or had a large margin of error.1,2
Alcohol Use Disorder in the United States
Adults Ages 18 and Older
According to the 2021 NSDUH, 28.6 million adults ages 18 and older (11.3% in this age group) had AUD in the past year.1,2 This includes:
- 16.3 million men ages 18 and older (13.2% in this age group)1,2
- 12.4 million women ages 18 and older (9.5% in this age group)1,2
- 18.2 million White adults ages 18 and older (11.5% in this age group)1,2
- 3.4 million Black or African American adults ages 18 and older (11.1% in this age group)1,2
- 270,000 American Indian or Alaska Native adults ages 18 and older (16.7% in this age group)1,2
- 118,000 Native Hawaiian or other Pacific Islander adults ages 18 and older (13.4% in this age group)1,2
- 964,000 Asian adults ages 18 and older (6.4% in this age group)1,2
- 759,000 adults of two or more races ages 18 and older (17.0% in this age group)1,2
- 4.9 million Hispanic or Latino adults ages 18 and older (11.4% in this age group)1,2
Alcohol Treatment in the United States
Adults Ages 18 and Older
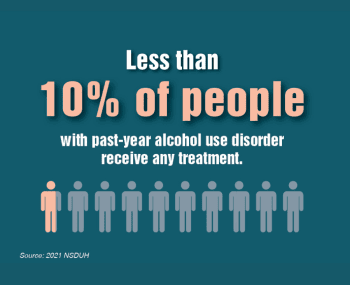
According to the 2021 NSDUH, 1.3 million adults ages 18 and older who had AUD in the past year (4.6% of those with past-year AUD in this age group) received any alcohol use treatment in the past year.1 This includes:
- 917,000 men ages 18 and older (5.6% of those with past-year AUD in this age group)1
- 417,000 women ages 18 and older (3.4% of those with past-year AUD in this age group)1
- 774,000 White adults ages 18 and older (4.2% of those with past-year AUD in this age group)1
- 263,000 Black or African American adults ages 18 and older (7.5% of those with past-year AUD in this age group)1
- 43,000 American Indian or Alaska Native adults ages 18 and older (16.6% of those with past-year AUD in this age group)1
- 8,000 Native Hawaiian or other Pacific Islander adults ages 18 and older (6.3% of those with past-year AUD in this age group)1
- 4,000 Asian adults ages 18 and older (0.4% of those with past-year AUD in this age group)1
- 53,000 adults of two or more races ages 18 and older (6.5% of those with past-year AUD in this age group)1
- 188,000 Hispanic or Latino adults ages 18 and older (3.8% of those with past-year AUD in this age group)1
- Among an estimated 14.1 million adults with past-year AUD in 2019, only 1.6% (or 223,000 persons) used evidence-based medications for treating AUD.2
- People with AUD were more likely to seek care from a primary care provider for an alcohol-related medical problem rather than specifically for drinking too much alcohol.3,4
Alcohol and the Human Body
- In 2021, of the 100,530 liver disease deaths among people ages 12 and older in 2021, 47.4% involved alcohol. Among males, 62,039 liver disease deaths occurred, with 50.2% involving alcohol. Among females, 38,491 liver disease deaths occurred, with 42.8% involving alcohol.1
- Among all cirrhosis deaths in 2019, 50.3% were alcohol related. The percentage of alcohol-associated cirrhosis deaths was highest (at 80.9%) among adults ages 25 to 34, followed by adults ages 35 to 44 (at 75.4%).2
- From 2010 to 2016, alcohol-associated liver disease was the primary cause of almost 1 in 3 liver transplants in the United States, replacing hepatitis C virus infection as the leading cause of liver transplantation due to chronic liver disease.3,4
- Research has shown that people who misuse alcohol have a greater risk of liver disease, heart disease, depression, stroke, and stomach bleeding, as well as cancers of the oral cavity, esophagus, larynx, pharynx, liver, colon, and rectum.5-8 These individuals may also have problems managing conditions such as diabetes, high blood pressure, pain, and sleep disorders. Misusing alcohol may also increase the likelihood of unsafe sexual behavior.
- Alcohol consumption is associated with increased risk of drowning and injuries from violence, falls, and motor vehicle crashes.9-12 Alcohol consumption is also associated with an increased risk of female breast cancer, oropharyngeal cancer, esophageal cancer (especially in individuals who inherit a deficiency in an enzyme involved in alcohol metabolism), and harmful medication interactions.3,8,13-18 Alcohol consumption has been linked to risk for fetal alcohol spectrum disorders in the offspring of women who consume alcohol during pregnancy.19

Alcohol and Pregnancy in the United States
- According to the 2021 National Survey on Drug Use and Health (NSDUH), 9.8% of pregnant women ages 15 to 44 in the United States used alcohol in the past month.1
- According to the 2021 NSDUH, 4.3% of pregnant women ages 15 to 44 in the United States reported binge drinking in the past month.1
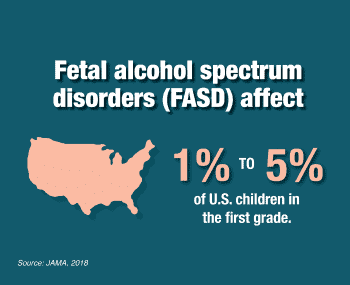
- A study supported by the National Institute on Alcohol Abuse and Alcoholism of more than 6,000 children in first grade across four U.S. communities estimated that as many as 1% to 5% of first-grade children have fetal alcohol spectrum disorders.2
Consequences for Families in the United States
- Approximately 10.5% (7.5 million) of U.S. children ages 17 and younger live with a parent who has alcohol use disorder, according to a 2017 report by the Substance Abuse and Mental Health Services Administration (SAMHSA).1
- Lipari RN, Van Horn SL. The CBHSQ report: children living with parents who have a substance use disorder. Rockville (MD): SAMHSA, Center for Behavioral Health Statistics and Quality; 2017 Aug 24 [cited 2020 Dec 8]. Available from: https://www.samhsa.gov/data/sites/default/files/report_3223/ShortReport-3223.html
Alcohol Related Emergencies and Deaths in the United States
- The rate of all alcohol-related emergency department visits increased 47.0% between 2006 and 2014, which translates to an average annual increase of 210,000 alcohol-related emergency department visits.1
- Alcohol contributes to approximately 18.5% of emergency department visits and 22.1% of overdose deaths related to prescription opioids.2
- It is estimated that more than 140,000 people (approximately 97,000 men and 43,000 women) die from alcohol-related causes annually, making alcohol the fourth-leading preventable cause of death in the United States behind tobacco, poor diet and physical inactivity, and illegal drugs.3,4
- An analysis of death certificates from 2019 and 2020 showed that deaths involving alcohol rose from approximately 79,000 to more than 99,000, a 25.5% increase.5
- Between 2015 and 2019, the leading causes of alcohol-attributable deaths due to chronic conditions in the United States were liver diseases (e.g., alcohol-associated liver diseases and unspecified liver cirrhosis), cardiovascular diseases, cancers of various types (e.g., organs of the upper respiratory and digestive tracts, liver, colon, and breast), and alcohol use disorder (AUD).3
- In 2021, alcohol-impaired driving fatalities accounted for 13,384 deaths (or 31% of overall driving fatalities).6
- According to the most recent estimate from the Centers for Disease Control and Prevention (CDC), 21.0% of suicide decedents have blood alcohol concentrations of 0.1% or more.7
- Among people who die by suicide, AUD is the second most common mental disorder and involved in roughly 1 in 4 deaths by suicide.8
References
- SAMHSA, Center for Behavioral Health Statistics and Quality. 2021 National Survey on Drug Use and Health. Table 2.25A—Alcohol use in lifetime: among people aged 12 or older; by age group and demographic characteristics, numbers in thousands, 2021. [cited 2023 Jan 11]. Available from: https://www.samhsa.gov/data/sites/default/files/reports/rpt39441/NSDUHDetailedTabs2021/NSDUHDetailedTabs2021/NSDUHDetTabsSect2pe2021.htm#tab2.25a
- SAMHSA, Center for Behavioral Health Statistics and Quality. 2021 National Survey on Drug Use and Health. Table 2.25B—Alcohol use in lifetime: among people aged 12 or older; by age group and demographic characteristics, percentages, 2021. [cited 2023 Jan 11]. Available from: https://www.samhsa.gov/data/sites/default/files/reports/rpt39441/NSDUHDetailedTabs2021/NSDUHDetailedTabs2021/NSDUHDetTabsSect2pe2021.htm#tab2.25b
- SAMHSA, Center for Behavioral Health Statistics and Quality. 2021 National Survey on Drug Use and Health. Table 2.26A—Alcohol use in past year: among people aged 12 or older; by age group and demographic characteristics, numbers in thousands, 2021. [cited 2023 Jan 11]. Available from: https://www.samhsa.gov/data/sites/default/files/reports/rpt39441/NSDUHDetailedTabs2021/NSDUHDetailedTabs2021/NSDUHDetTabsSect2pe2021.htm#tab2.26a
- SAMHSA, Center for Behavioral Health Statistics and Quality. 2021 National Survey on Drug Use and Health. Table 2.26B—Alcohol use in past year: among people aged 12 or older; by age group and demographic characteristics, percentages, 2021. [cited 2023 Jan 11]. Available from: https://www.samhsa.gov/data/sites/default/files/reports/rpt39441/NSDUHDetailedTabs2021/NSDUHDetailedTabs2021/NSDUHDetTabsSect2pe2021.htm#tab2.26b
- SAMHSA, Center for Behavioral Health Statistics and Quality. 2021 National Survey on Drug Use and Health. Table 2.27A—Alcohol use in past month: among people aged 12 or older; by age group and demographic characteristics, numbers in thousands, 2021. [cited 2023 Jan 11]. Available from: https://www.samhsa.gov/data/sites/default/files/reports/rpt39441/NSDUHDetailedTabs2021/NSDUHDetailedTabs2021/NSDUHDetTabsSect2pe2021.htm#tab2.27a
- SAMHSA, Center for Behavioral Health Statistics and Quality. 2021 National Survey on Drug Use and Health. Table 2.27B—Alcohol use in past month: among people aged 12 or older; by age group and demographic characteristics, percentages, 2021. [cited 2023 Jan 11]. Available from: https://www.samhsa.gov/data/sites/default/files/reports/rpt39441/NSDUHDetailedTabs2021/NSDUHDetailedTabs2021/NSDUHDetTabsSect2pe2021.htm#tab2.27b
- SAMHSA, Center for Behavioral Health Statistics and Quality. 2021 National Survey on Drug Use and Health. Table 2.28A—Binge alcohol use in past month: among people aged 12 or older; by age group and demographic characteristics, numbers in thousands, 2021. [cited 2023 Jan 11]. Available from: https://www.samhsa.gov/data/sites/default/files/reports/rpt39441/NSDUHDetailedTabs2021/NSDUHDetailedTabs2021/NSDUHDetTabsSect2pe2021.htm#tab2.28a
- SAMHSA, Center for Behavioral Health Statistics and Quality. 2021 National Survey on Drug Use and Health. Table 2.28B—Binge alcohol use in past month: among people aged 12 or older; by age group and demographic characteristics, percentages, 2021. [cited 2023 Jan 11]. Available from: https://www.samhsa.gov/data/sites/default/files/reports/rpt39441/NSDUHDetailedTabs2021/NSDUHDetailedTabs2021/NSDUHDetTabsSect2pe2021.htm#tab2.28b
- SAMHSA, Center for Behavioral Health Statistics and Quality. 2021 National Survey on Drug Use and Health. Table 2.29A—Heavy alcohol use in past month: among people aged 12 or older; by age group and demographic characteristics, numbers in thousands, 2021. [cited 2023 Jan 11]. Available from: https://www.samhsa.gov/data/sites/default/files/reports/rpt39441/NSDUHDetailedTabs2021/NSDUHDetailedTabs2021/NSDUHDetTabsSect2pe2021.htm#tab2.29a
- SAMHSA, Center for Behavioral Health Statistics and Quality. 2021 National Survey on Drug Use and Health. Table 2.29B—Heavy alcohol use in past month: among people aged 12 or older; by age group and demographic characteristics, percentages, 2021. [cited 2023 Jan 11]. Available from: https://www.samhsa.gov/data/sites/default/files/reports/rpt39441/NSDUHDetailedTabs2021/NSDUHDetailedTabs2021/NSDUHDetTabsSect2pe2021.htm#tab2.29b
- Hingson RW, Zha W, White AM. Drinking beyond the binge threshold: predictors, consequences, and changes in the U.S. Am J Prev Med. 2017;52(6):717-27. PubMed PMID: 28526355